Contoh Kasus
- Punya server besar dengan multiple Redis yang ingin dimonitoring dengan satu redis_exporter saja
How To
Untuk basic Redis monitoring, silahkan baca di post Monitoring Redis Dengan redis_exporter
- Siapkan
docker-compose.ymlisi dengan
name: redis-exporter
services:
    redis-exporter:
      image: oliver006/redis_exporter:latest
      container_name: redis-stack-exporter-ctr
      command:
        - "-redis.password-file=/etc/redis.password"
        - "-redis.addr="
      volumes:
        - "./redis.password:/etc/redis.password:ro"
      network_mode: host
      restart: always
- Buat file
redis.password
{
  "redis://192.168.1.2:6379":"YourRedisPassword",
  "redis://192.168.1.2:6380":"YourRedisPassword",
  "redis://192.168.1.2:6381":"YourRedisPassword"
}
- Pindah ke konfigurasi Prometheus, buka file
prometheus.ymldan tambahkan
- job_name: 'redis_exporter_targets'
  static_configs:
    - targets:
      - redis://192.168.1.2:6379
      - redis://192.168.1.2:6380
      - redis://192.168.1.2:6381
  metrics_path: /scrape
  relabel_configs:
    - source_labels: [__address__]
      target_label: __param_target
    - source_labels: [__param_target]
      target_label: instance
    - target_label: __address__
      replacement: 192.168.1.2:9121


- job_name: redis_exporter
  scrape_interval: 20s
  static_configs:
  - targets:
    - 192.168.1.2:9121
- Reload Prometheus dan cek Grafana

Metric Sudah Terbaca
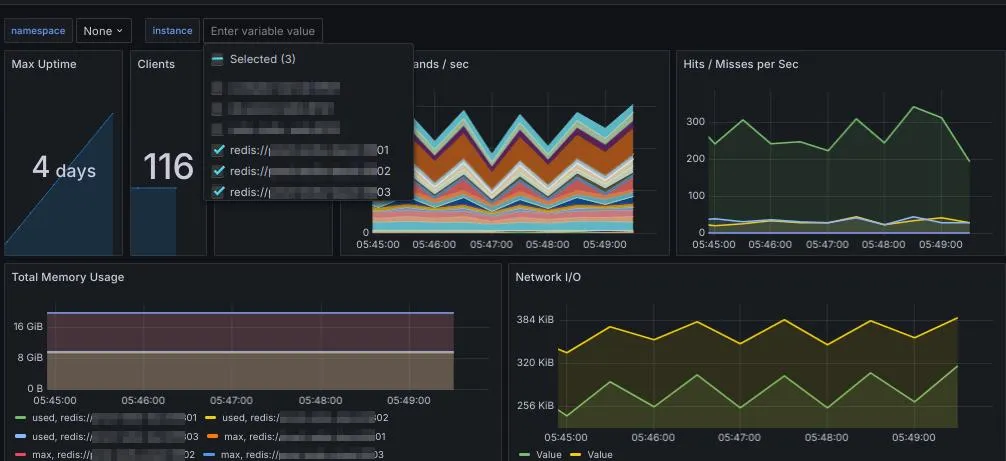
Tampilan di Grafana