
Halo, kalau kamu merasa tulisan saya ngebantu kamu, kamu bisa ucapkan terima kasih lewat saweria .
Hello, if you find this article helpful, you can express your gratitude through saweria .
What I Used in This Tutorial
Nginx v1.24.0 from ondrej PPA.
Ubuntu 22.04.3 LTS
Grafana v10.1.5 ](I use dockprom for monitoring stack)
How To
- Install some dependency tools before installing nginx-vts-module from source
sudo apt-get install -y build-essential libpcre2-dev libpcre3-dev zlib1g zlib1g-dev libssl-dev make
- Download and extract nginx-modules-vts
mkdir -p ~/software/nginx-vts
cd ~/software/nginx-vts
#download nginx modules
wget https://github.com/vozlt/nginx-module-vts/archive/v0.2.2.tar.gz
#extract it
tar -zxvf v0.2.2.tar.gz
- Download nginx source (make sure it has the same version as your existing nginx)
mkdir ~/software/nginx-vts
cd ~/software/nginx-vts
#download nginx from source
wget http://nginx.org/download/nginx-1.24.0.tar.gz
#extract it
tar -zvxf nginx-1.24.0.tar.gz
- Then we need to compile it
#go to nginx source folder
cd ~/software/nginx-vts/nginx-1.24.0/
#if it cannot use ~, use full path instead
./configure --with-compat --add-dynamic-module=/home/userkamu/software/nginx-vts/nginx-module-vts-0.2.2

#compile modules
make modules

#copy vts modules result
sudo cp -v ~/software/nginx-vts/nginx-1.24.0/objs/ngx_http_vhost_traffic_status_module.so /usr/share/nginx/modules/

#then create new modules on nginx folder
sudo touch /usr/share/nginx/modules-available/mod-nginx-vts.conf

#then fill with
echo "load_module modules/ngx_http_vhost_traffic_status_module.so;" | sudo tee -a /usr/share/nginx/modules-available/mod-nginx-vts.conf

#enabled modules
sudo ln -s /usr/share/nginx/modules-available/mod-nginx-vts.conf /etc/nginx/modules-enabled/50-mod-nginx-vts.conf
Load nginx-vts modules function in your nginx.conf
user www-data;
worker_processes auto;
pid /run/nginx.pid;
worker_rlimit_nofile 65535;

#this line already exist
include /etc/nginx/modules-enabled/*.conf;

events {
    #worker_connections 768;
    multi_accept on;
    worker_connections 65535;
}

http {
    #add this line
    vhost_traffic_status_zone;

    .
    .
    .
To add nginx-vts modules at your app, add this to your app config
server {
  server_name ipang.my.id;
  .
  .
  .
  location /status {
    vhost_traffic_status_display;
    #it available in json, prometheus
    vhost_traffic_status_display_format html;
  }
  .
  .
  .
}
nginx-vts HTML Format
Create a new nginx app config to enable prometheus metrics
server {
    listen 9145;
    allow 192.168.1.0/24;
    deny all;
    location /metrics {
        vhost_traffic_status_display;
        #for this we use prometheus format
        vhost_traffic_status_display_format prometheus;

    }
}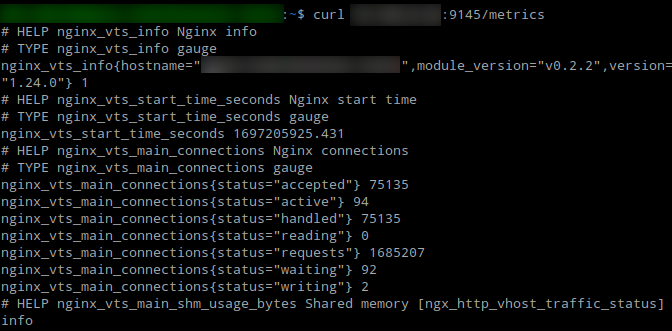
nginx-vts Prometheus
Now go to your Grafana dashboard, import this dashboard
14824
Grafana nginx-vts Dashboard
Reference: