
Halo, kalau kamu merasa tulisan saya ngebantu kamu, kamu bisa ucapkan terima kasih lewat saweria .
If you feel this website help you, you can donate at saweria .
List Tools That I Used in This Tutorial
How To
- This was example file docker-compose with NATS & it exporter
version: "3.8"

services:

  nats:
    container_name: nats
    image: nats:latest
    restart: unless-stopped
    ports:
      - "4222:4222"
    # -p 4222, run nats on port 4222
    # -m 8222, run metric on port 8222
    command: "-p 4222 -m 8222"
    networks:
      - nats-public

  nats_exporter:
    image: natsio/prometheus-nats-exporter:latest
    restart: unless-stopped
    depends_on:
      - nats
    container_name: nats_exporter
    ports:
      - "7777:7777"
    command: "-varz -jsz=all http://nats:8222"
    networks:
      - nats-public

networks:
  nats-public:
- To check if it running correctly, use
docker logs -f nats&docker logs -f nats_exporter, if both running then you can check nats metric withcurl localhost:7777/metrics
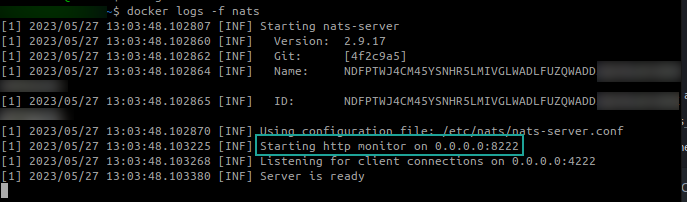
Check NATS docker logs
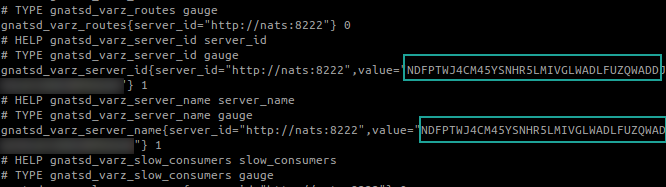
Make Sure, It Got A Same Name With NATS Server
Then go to your grafana
a. Import dashboard
b. Copy JSON file from this prometheus-nats-exporter github
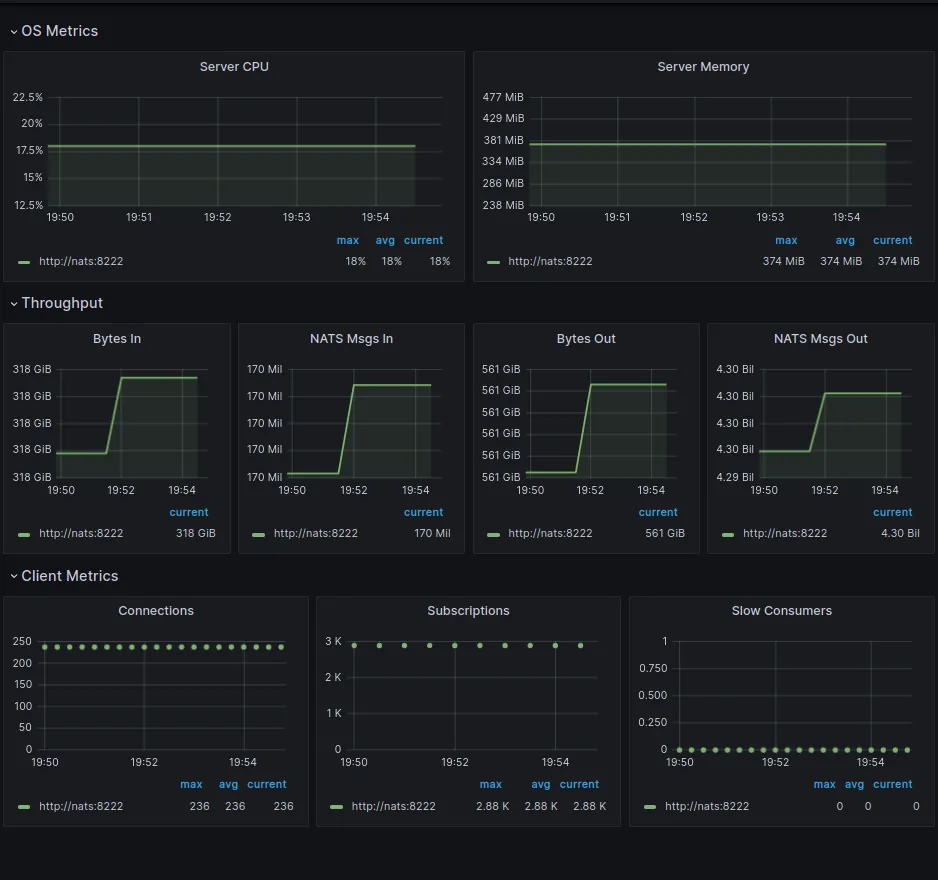
NATS Dashboard on Grafana
Source:
A Walkthrough of Monitoring NATS with Prometheus and Grafana